Performance Testing of a software is as important as any other activity required in the development of the software. Performance Testing is performed on a software to understand the behaviour of the software under a certain workload. Performance Testing is one of the key aspects of Quality Assurance of a software application.
Performance Testing is one of the main types of Non-Functional Testing for software applications. It is briefly classified into Load Testing and Stress Testing. In Load Testing, the Application Under Test (AUT) is subjected to a specific expected load. In Stress Testing, the AUT is subjected to workload which is above the handling capacity of the application. This is done to determine the breaking point of the software. To simulate high workload, performance testing tools are used. One of the best and most commonly used performance testing tools in the market is Apache JMeter developed by the Apache Foundation. It is widely used across the globe for performance testing of Web Applications as well as Mobile Apps. Let’s learn in detail about Apache JMeter.
The Apache JMeter application is an open source software and a pure Java application designed to load test functional behavior and measure performance. It can be used to simulate a concurrent heavy load of virtual users on a server, group of servers or networks to test its strength, load handling capacity and to analyze overall performance under different load types. Lets us see some features of JMeter which makes it attractive to performance testers around the world.
Open Source: As already mentioned, JMeter is an open source software and it is also a 100% pure Java application. The developer can use its source code, can modify and customize it as per their requirement. They can also contribute their code to make a better JMeter. Due to this feature, there are various interesting and helpful plugins available to use with JMeter, which were developed by the IT community worldwide.
And since JMeter is a Java application, it is also platform independent. It can be operated without any problem in any operating system, be it Windows, Mac or Unix based Operating System.
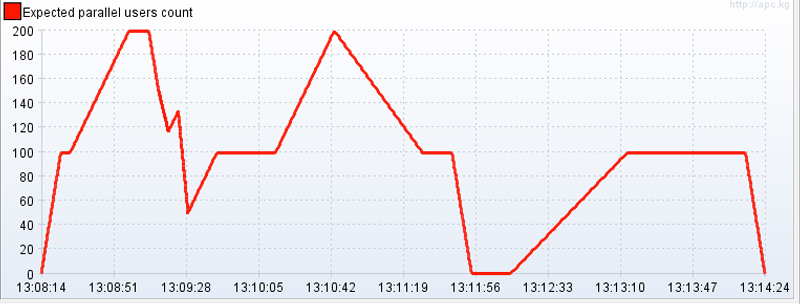
Realistic Performance Testing: In a real scenario of a large number of users using the application, the load of real users may not always increase or decrease gradually. The load may be normal at one minute, increase suddenly in the next, while it may decrease significantly the next minute and again increase suddenly afterward. This increase and decrease in the load may be gradual, exponential or sudden.
 Image Source: http://jmeterplugins.com/wiki/UltimateThreadGroup/index.html
We can simulate this real-world load in JMeter. Using the Concurrency Thread Group or Ultimate Thread Group in JMeter, we can increase, decrease or hold a certain load for a specific period of time. We can also enter random time delays in the load test script to simulate actual user actions. This helps in simulating workload which are as close as possible to actual world scenarios.
Script Recording: To load test an application a set of functionalities like Login, manipulating some data and logging out are generally tested. To simulate this action, instead of entering each request manually, we can record the functionality and re-run it for N multiple of Virtual users. This will simulate the scenario of multiple users accessing the functionality concurrently. To record a test in JMeter, we can use two methods – HTTP Proxy Recorder and Blazemeter Plugin.
~ HTTP(S) Test Script Recorder: In HTTP Test Script Recorder, we have to set up a proxy network in the system on which our application is running. We have to enter the port number of the IP address in HTTP Recorder, on which the JMeter will be listening for server activity. The server requests of the actions performed in the application will be recorded by the JMeter. The user can save the generated script and then run the script for multiple virtual users to simulate the action. The HTTP Recorder can be used for recording script in web applications as well as mobile apps.
~ Blazemeter Recorder: Blazemeter has developed a Google Chrome plugin for recording performance scripts. The Blazemeter plugin enables the user to record a script and later download the script for running it using JMeter. Similar to HTTP Proxy Recorder, it records all the HTTP/S requests that your browser sends. One drawback of Chrome’s Blazemeter plugin is that it cannot be used for recording mobile app performance scripts.
Non-GUI Mode: While running a JMeter test using GUI mode, a lot of resources like memory, and Swap are consumed which may lead to faulty test results. JMeter provides a solution to this problem. JMeter can run load tests without the GUI, but from the Command Prompt or Terminal of the system. JMeter provides various commands for running JMeter from the command line. Reports generated during the load tests are saved at a location specified by the user. These reports can be used to generate graphs later on. Running on Non-GUI mode consumes much fewer resources than in GUI mode.
 Image Source: https://octoperf.com/blog/2017/10/19/how-to-analyze-jmeter-results/
For running JMeter from the command line, a user has to set up the test in JMeter using the GUI mode and save it to a specified location. JMeter GUI mode must be shut down before starting the test. The user then has to open the command line and navigate to the bin folder of Apache JMeter. From here, the user can give a command to JMeter like to run the test, save the result to a specific folder, generate dashboard report, run the test on specific servers, etc.
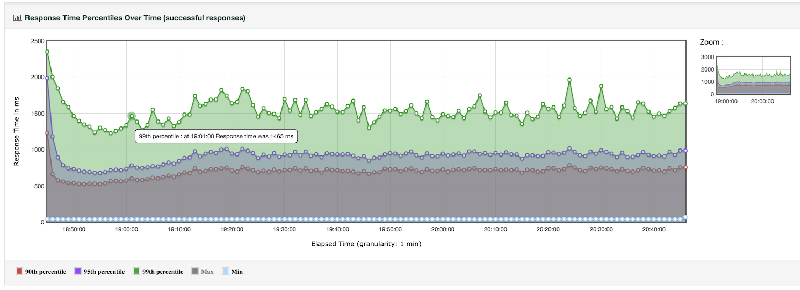
Generating Graphs and Reports: JMeter is widely known for providing various graph, reports, and listeners. One of the key aspect of Performance Testing is Understanding and reporting the faults and drawbacks and taking necessary steps to correct them. To understand the results properly, JMeter can generate various graphs and reports. Some widely listeners are Tree listener, Table listener, Aggregate report listener. Using these listeners we can find various parameters like latency, response time, connect time of the performance test. This data can be used to make reports and understand the outcome of the test.
 Image source: https://jmeter.apache.org/usermanual/generating-dashboard.html
For a better understanding of the outcome of the test, JMeter has a Graph Listener, which can generate beautiful graphs to simplify the understanding of the outcome of the test. These reports and graphs can be exported to make the performance report.
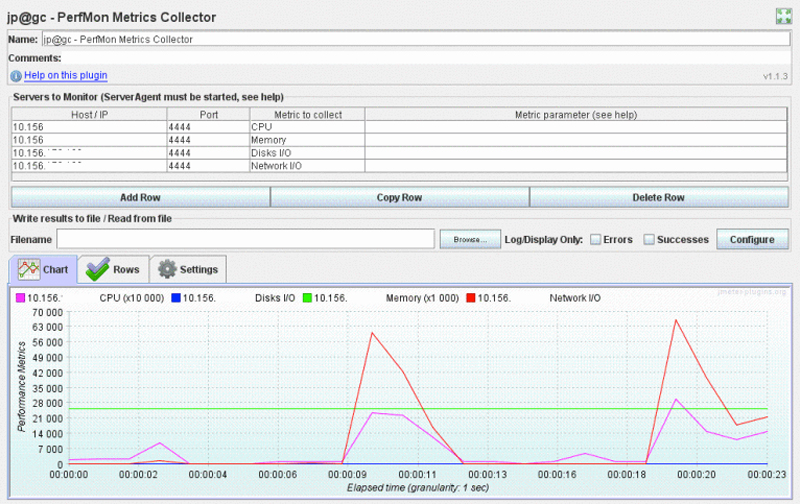
Server-Side Monitoring: During Performance Testing, it is important to know the health of your side and how the server responds to changes in the load. JMeter provides a PerfMon plugin which is used for collecting and monitoring Server metrics like CPU, Memory, Swap, Disks I/O and Networks I/O. The PerfMon plugin consists of two parts:
~ The Server Agent: The Server Agent has to be installed on the system on which the server of the AUT is running. The Server Agents collects information on the server and send the information to JMeter via TCP or UDP protocol.
~ The Metrics Collector Listener: The user can view the information through the Metrics Collector Listener. We can choose which metrics we want to monitor and JMeter generates graphs using those metrics. We can also export the metrics and graphs for later use.
 Image Source: https://udayhere.wordpress.com/2014/07/04/perfmon-for-jmeter/
Conclusion
The large number of Plugins available for JMeter is the real reason behind the JMeter being the most widely used Load Testing tool. The simplicity and ease with which JMeter can be operated is also a plus point for performance testers. While there are many other performance tools for automation testing, but none are as successful as Apache JMeter.


